Handling missing values with Interpolation - pandas.DataFrame.interpolate

Introduction
Interpolation is one of the many techniques used to handle missing data during the data-cleaning process. It is a technique in the Pandas DataFrame library used to estimate unknown data points between two known data points. Interpolation is the process of approximating the value of a given function at a given set of discrete points. For example, if you have data that shows the price of two items at $12 and $14 each with a missing value, interpolation estimates the missing value price at $13.
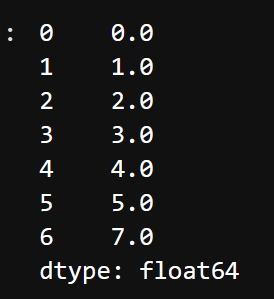
Here’s an example of how interpolation works with a series. I created a series with pandas and inserted a NaN value into it. I then tried to fill the missing value with some interpolated values by implementing the interpolate method.
#Filling NaN in series data via linear interpolation
import pandas as pd
import numpy as np
a = pd.Series([0, 1, np.nan, 3, 4, 5, 7])
#Output
a.interpolate()
See the output of the interpolated series below:
When to use Interpolation
Interpolation is a technique that can be employed to determine missing values or null values by utilizing data from its neighbouring values. In cases where imputing missing values with the mean is not the best approach, Interpolation is often considered as a viable alternative. This technique is commonly used in time-series data to fill in missing values with the previous one or two values. For instance, in the case of temperature data, it would be preferable to use the mean of the last two days to fill in today's temperature, rather than the mean of the entire month. Additionally, Interpolation can also be employed to calculate moving averages. Interpolation is very useful when filling values in a time series data because analyzing time series data is a bit different from normal data frames as the filling will be in series and in data frames.
Interpolation with Data Frame
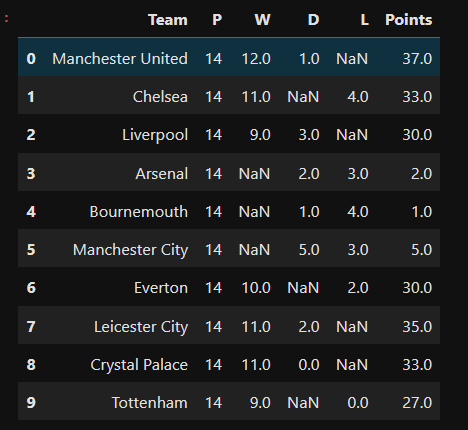
I created a sample DataFrame of the English Premier League table consisting of ten teams to see how interpolation works in a DataFrame. I imputed random NaN values in the Python code, which can be seen below:
#create a dataframe of EPL table with ten teams
EPL_table = pd.DataFrame({"Team":["Manchester United", "Chelsea", "Liverpool", "Arsenal", "Bournemouth", "Manchester City", "Everton", "Leicester City", "Crystal Palace", "Tottenham"],
                   "P":[14, 14, 14, 14, 14, 14, 14, 14, 14, 14],
                   "W":[12, 11, 9, None, None, None, 10, 11, 11, 9],
                   "D":[1, None, 3, 2, 1, 5, None, 2, 0, None],
                   "L":[None, 4, None, 3, 4, 3, 2, None, None, 0]})

#create a function to calculate the wins, draws and losses into a points column
def Points(EPL_table):
    #replacing NaN values with 0
    W = EPL_table['W'].fillna(0)
    D = EPL_table['D'].fillna(0)
    L = EPL_table['L'].fillna(0)

    result_W = W * 3 #3 points for a win
    result_D = D * 1 #1 point for a draw
    result_L = L * 0 #0 point for a loss

    EPL_table = EPL_table.assign(Points=result_W + result_D + result_L)
    EPL_table['Points'] = EPL_table['Points'].fillna(0) #replacing NaN values with 0 and assigning back to points
    return EPL_table

EPL_table = Points(EPL_table) #updating the EPL_table with the newly computed Points column
EPL_table
Here is the output of the above code in a DataFrame with the missing values:
Methods of Interpolation
Linear Interpolation
Linear Interpolation simply means to estimate a missing value by connecting dots in a straight line in increasing order. This could be in two directions:
Linear interpolation in Forward Direction
The linear method ignores the index and assumes that the missing values are uniformly spaced. It then attempts to estimate the best value to replace the missing data based on the values that precede it. However, if the missing value occurs at the first index, it remains as a
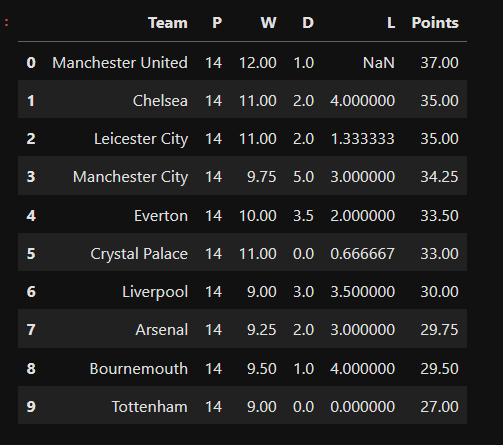
NaNvalue. Usingdataframe.interpolatesee an example of how the linear method is applied to our EPL DataFrame#Linear method of interpolation in a forward direction EPL_table_Lin = EPL_table.interpolate(method='linear', limit_direction='forward', axis=0) EPL_table_Lin = Points(EPL_table_Lin) #updating the linear table EPL_table_Lin = EPL_table_Lin.sort_values("Points", ascending=False).reset_index(drop=True) #sort teams according to highest points) EPL_table_Lin
As described above, you can see in the result below that a missing value occurs at the first index of column "L" which is a NaN value.
- Linear interpolation in Backward Direction (bfill)
The method is the same as the forward direction as explained above, only the order in which we want to perform changes differs. The backward method works from the end of the DataFrame which could also be understood as the bottom-to-top approach. If the missing value occurs at the last index, it remains as a NaN value. Check out this example
    #Linear method of interpolation in a backward direction
    EPL_table_Lin = EPL_table.interpolate(method='linear', limit_direction='backward', axis=0)
    EPL_table_Lin = Points(EPL_table_Lin) #updating the linear table
    EPL_table_Lin = EPL_table_Lin.sort_values("Points", ascending=False).reset_index(drop=True) #sort teams according to highest points)
    EPL_table_Lin
You would see that the output below is the same as above except that a missing value now occurs at the last index of "D" which is a NaN value.

Polynomial Interpolation
In a polynomial interpolation, an order is specified. It means that polynomial interpolation fills missing values with the lowest possible degree that passes through available data points. Filling in
NaNin a Series or DataFrame via polynomial interpolation or splines: both ‘polynomial’ and ‘spline’ methods require that you also specify anorder(int). If you pass an order as 1, then the output will be similar to linear because the polynomial of order 1 is linear. If it is set to 2 as in this case, it means that a quadratic polynomial will be used. See an example of how the polynomial method is applied to our EPL DataFrameEPL_table_Pol = EPL_table.interpolate(method='polynomial', order=2) #using polynomial method to fill in the variables EPL_table_Pol = Points(EPL_table_Pol) #updating the linear table EPL_table_Pol = EPL_table_Pol.sort_values("Points", ascending=False).reset_index(drop=True) #sort teams according to highest points) EPL_table_PolSee the output of the above polynomial method below:

Interpolation through Padding
Interpolation through padding simply means filling missing values with the same value present above them in the dataset. If the missing value is in the first row, then this method will not work. While using this technique, you also need to specify the limit of the
NaNvalues to be filled. For example, if you have aDataFramewith 100 rows and 10 consecutiveNaNsin each row, you can set the limit to 10 to fill in all the missing values. If you set the limit to 5, only the first 5 consecutiveNaNsin each row will be filled. In the code below, I specifiedlimit=10because there are ten missing values.EPL_table_pad = EPL_table.interpolate(method='pad', limit=10) #using linear method to fill in the variables EPL_table_pad = Points(EPL_table_pad) #updating the linear table EPL_table_pad = EPL_table_pad.sort_values("Points", ascending=False).reset_index(drop=True) #sort teams according to highest points) EPL_table_padSee output of the above code below:

Lastly, take note that Interpolation through padding is also known as forward fill or last observation carried forward (LOCF)
Conclusion
I believe that you now have a good understanding of what interpolation is and how you can use various methods to handle missing values in a series or DataFrame. Interpolation is one of the most powerful techniques in handling missing values, and it is important for every data scientist or data analyst to know how to use it since handling missing values is an essential aspect of the data cleaning process.

